Figure 3.21—SAFE Metrics for KRIs With Applicable Tests
Source: Giudici, P.; Centurelli, M.; et al.; “Artificial Intelligence Risk Measurement,” Expert Systems with Applications, vol. 235, 2024, link
AI risk monitoring includes the ongoing process of addressing identified risk and responding according to accepted risk remediation plans. In order to effectively monitor risk, appropriate and relevant metrics should be established for model performance and return on investment (ROI) in addition to security metrics related to AI solutions.
AI is continuously evolving, and the rate at which new AI solutions and functions are being introduced requires organizations developing or using AI solutions to proactively address the potential for change. In addition, the threat landscape is also evolving and must be monitored. Processes for assessing emerging risk must be in place along with mechanisms for continuous improvement. Continuous improvement can draw input from the following sources:
Continuous improvement efforts should be documented and tracked. In most cases, these efforts are included in a central risk register integrated with an organization’s general risk management processes.
Key risk indicators (KRIs) provide early warnings for potential incidents, helping an enterprise identify exposure to risk events that may impact its strategic objectives, operational resilience, compliance obligations, or overall performance. Generally, KRIs include a threshold above which alerts are sent to individuals assigned to monitor risk.
KRIs depend on whether the AI solution in question is developed by the enterprise or purchased for use from a third party. Purchased AI solutions can adapt standard KRI setting processes that follow expected business process outcomes. For example, if an organization is considering implementing a chatbot designed for customer service, a key risk they may want to avoid could be lower customer satisfaction scores. In this instance, coordination with key performance indicators (KPIs) is likely relevant. Figure 3.19 provides examples of KPIs.
Figure 3.19—Examples of Key Performance Indicators for a Chatbot
| Indicator | Description | Target |
|---|---|---|
| Customer satisfaction score | Measurement of overall customer satisfaction with chatbot interactions | 95% satisfaction rate or higher |
| Resolution rate | Percentage of customer inquiries resolved by the chatbot without human intervention | At least 90% resolution rate |
| Misunderstanding rate | Percentage of interactions in which the chatbot fails to understand or respond accurately | Less than 1% misunderstanding |
| Escalation rate | Percentage of chat sessions escalated to human support due to chatbot limitations | Less than 10% of interactions |
Source: ISACA, Keeping Pace with the Rise of AI: Your Guide to Policies, Ethics, and Risk, 1 November 2024, link
Developed AI solutions pose additional challenges and considerations with respect to identification of KRIs. These KRIs generally rely on statistical analysis and require input from a cross-functional team (e.g., risk management, audit, statistician). One example of a framework that addresses KRIs in AI is the Key Artificial Intelligence Risk Indicators (KAIRI) framework.188 Figure 3.20 provides KRI examples from KAIRI that meet SAFE (sustainability, accuracy, fairness, explainability) requirements.
Figure 3.20—KRI Examples of SAFE
| KRI | Description/Purpose |
|---|---|
| Sustainability | Focuses on robustness and stability against anomalies or cybermanipulation |
| Accuracy | Measures predictive accuracy by comparing predictions with observed evidence |
| Fairness | Ensures equitable treatment of diverse population groups in AI applications |
| Explainability | Ensures models are interpretable by key stakeholders |
Source: Adapted from Giudici, P.; Centurelli, M.; et al.; “Artificial intelligence risk measurement,” Expert Systems with Applications, vol. 235, 2024, link
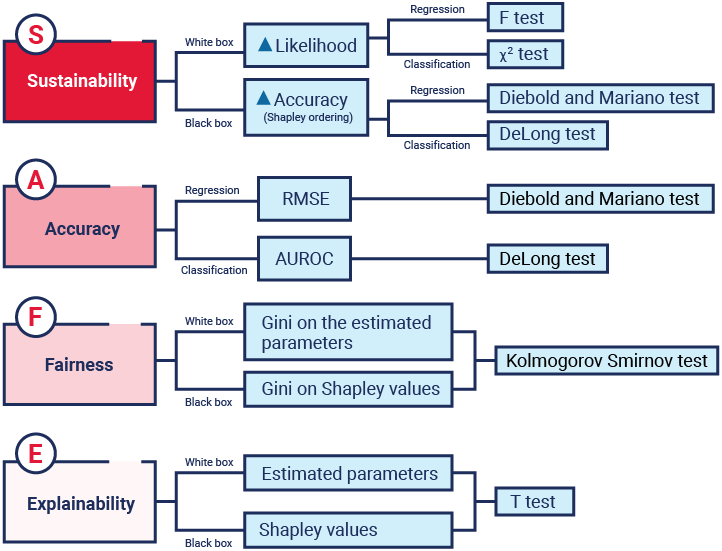
Practitioners should note that SAFE dimensions may involve trade-offs (e.g., fairness vs. accuracy), requiring balance based on enterprise priorities. A KRI for a developed AI solution will depend on whether the solution is white box or black box and the method in which the model works (e.g., regression, classification). Figure 3.21 shows applicable KRIs, metrics, and applicable tests that can be employed.
Figure 3.21—SAFE Metrics for KRIs With Applicable Tests
Source: Giudici, P.; Centurelli, M.; et al.; “Artificial Intelligence Risk Measurement,” Expert Systems with Applications, vol. 235, 2024, link
As mentioned, AI models have the potential to degrade over time, with predictions and performance being affected as datasets grow stale or the model fails to adapt when encountering new data and scenarios. This means that training an AI model is not a one-time effort; it requires continual human oversight and monitoring to ensure it continues to perform as expected. In addition to performance metrics, enterprises should monitor robustness metrics such as data drift, concept drift, and adversarial robustness to detect long-term AI degradation. Performance metrics, also called classification metrics, measure areas such as accuracy, precision, and recall.189 Figure 3.22 lists some common AI model performance metrics.
Figure 3.22—Common Metrics for AI Model Performance
| Metric | Description |
|---|---|
| Accuracy | The ratio of correct predictions or decisions (e.g., true positives and true negatives) the model makes with the total number of cases |
| Area under receiver operating characteristic curve (AUC-ROC) | A measure of how well the model can correctly predict classes based on input data; an AUC of 0.5 indicates the model is simply guessing vs. an AUC of 1, which shows it can correctly discriminate |
| Bidirectional encoder representations from transformers (BERT) score | A measure of semantic similarities between an AI-generated sentence and a human-generated reference |
| Bilingual evaluation understudy (BLEU) score | A measure of the quality of text generation that measures segments of text (n-grams) against human-generated output but does not consider semantics in its measure; considered a standard for evaluating machine translation |
| F1 score | A metric that measures the harmonic mean of precision and recall to ensure that both are equally represented, especially when dealing with imbalanced data classes; F1 score = 2 × (Precision × Recall) / (Precision + Recall) |
| Mean absolute error (MAE) | A regression metric that shows how close predictions are to actual values on average; helps to monitor the safety and robustness of model performance. |
| Mean squared error (MSE) | A regression metric that is used to show the average error between predicated and actual values and how the model performs under normal conditions and maintains performance across time |
| Precision | The ratio of true positives to false positives; measures the accuracy of positive predictions |
| Recall | Also known as sensitivity or true positive rate, a measure of the ability of a model to correctly identify all actual positives within a dataset |
| Root mean squared error (RMSE) | The square root of MSE, which shows the magnitude of errors made, giving a higher weight to more significant errors (e.g., outliers); helps to identify models that have low chance of error but make more significant ones |
| Recall-oriented understudy for Gisting evaluation (ROUGE) | A metric that measures how well a model generates a summary of information against a human-generated reference |
Source: Brondson, C.; “Accuracy Metrics to Evaluate AI Model Performance,” Galileo, 21 February 2025, link; OECD.AI, “Catalogue of Tools & Metrics for Trustworthy AI,” link; Version 1, “AI Metrics: The Science and Art of Measuring Artificial Intelligence,” 24 November 2023, link
In addition to monitoring and reporting on how well an AI model continues to perform, enterprises should monitor and measure how the overall AI program is performing. This includes areas such as adoption, reliability, and operations.
Some considerations for deployment and performance metrics related to AI solutions include:
Metrics and monitoring provide risk management teams with valuable information that must then be communicated to relevant stakeholders, such as the board of directors, developers, and other key departments. As many stakeholders may not be familiar with the technical nuances of AI solutions, it is important for risk practitioners to ensure that they understand what is being reported, the implications, and, if necessary, the actions or decisions made or needed.
Reports may take the form of dashboards that provide vast amounts of data in an easy-to-read format, written reports, such as audit findings and risk assessments, or presentations in front of the board. Risk practitioners should ensure that the methods and messages of AI-related reports provide the right information to the right people in the right way.
For example, key information that should be included in an AI risk board report may include:193
Effective escalation processes are critical to ensure that AI risk findings are addressed in a timely way. Escalation processes establish clear accountability and enable prompt responses to identified risk, thereby supporting robust AI risk governance and control.
Escalation mechanisms serve to communicate AI risk issues beyond the immediate operational teams to higher management tiers, including executive leadership and governance committees. This ensures that decision-makers are informed of significant AI risk, compliance concerns, or performance deviations that may impact the organization’s objectives or regulatory standing. Timely escalation facilitates appropriate risk treatment actions, resource allocation, and policy adjustments, reinforcing organizational accountability and oversight.
Key elements for AI risk escalation include:
Automating AI risk reporting processes offers significant benefits in enhancing the efficiency, accuracy, and timeliness of delivering risk information to stakeholders. Business intelligence (BI) solutions, data analytics tools, and visualization software can all aid risk practitioners in creating customized reports for various stakeholders.
Benefits of automated reporting include:
Methods for automating risk reporting include:
BI has grown as a useful approach for enterprises to make data-driven decisions related to their business operations, including managing risk. BI shares many of the same attributes as AI; however, they are distinct concepts.
BI is defined as a technology-driven process that gathers, analyzes, processes, and reports on data to help enterprises make decisions.194 Similar to AI, BI relies on high-quality data to enable leadership to make the best decisions based on the analysis provided. BI presents data in a way that is easier for humans to understand and analyze, whereas AI can make predictions based on data.
BI and AI can work together to help with risk reporting. Examples include the use of:195